August 8, 2017
Introduction
As the economy grows, the gains are concentrated on the state’s richest residents. Inequality is on the rise, both nationally and in Wisconsin. Over the last 40 years, Wisconsin’s richest residents have experienced dramatic increases in income, yet the rest of the state’s residents have experienced little or no income growth.
The widening chasm between the very highest earners and everyone else poses hardships for Wisconsin’s families, businesses, and communities. Families can’t thrive when income growth is nearly non-existent for everyone except those at the top, and businesses need a strong middle class bolstered by broad-based income growth to generate customers. Wisconsin communities pay the price if too many families and businesses fail to prosper.
Growing income inequality is also bad for Wisconsin’s economic growth. To build a solid, fast-growing economy, we need to make sure that Wisconsin has a healthy, well-educated workforce. But if nearly all the gains from economic growth benefit only a few, many Wisconsin residents won’t have the resources they need to become the kind of skilled workers our economy needs for the future. That hurts everyone.
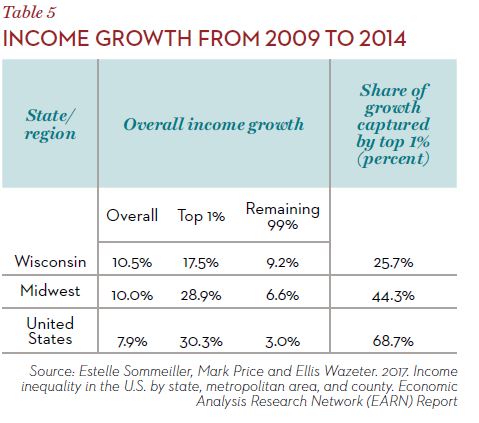
All figures in this report come from Income Inequality in the U.S. by State, Metropolitan Area, and County, 1917 to 2014, a dataset developed by Estelle Sommeiller, Mark Price, and Ellis Wazeter for the Economic Analysis and Research Network that includes information about top incomes at the state and local levels. Income figures are presented in 2015 dollars.
At the Top: How Much Does the Top 1% Make?
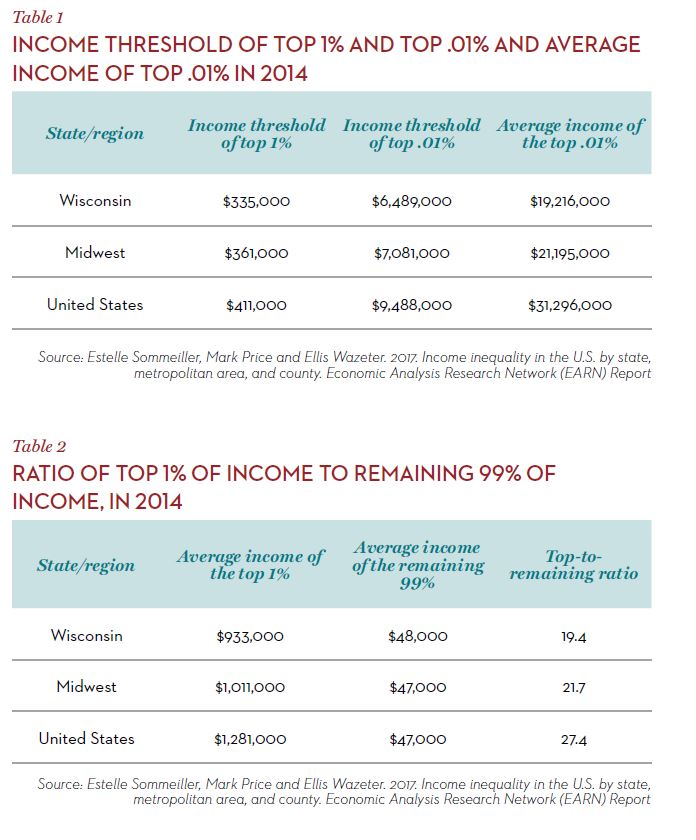
There is a vast gap between the incomes of the highest earners in Wisconsin and the incomes of typical Wisconsin residents. In Wisconsin, the top 1% of earners had income of $335,000 or higher in 2014. The top .01% in Wisconsin – the top 1 out of 10,000 – had incomes of at least $6.5 million.
In Wisconsin, the top 1% made, on average, 19 times the average annual income of $48,000 that the remaining 99% of residents made. Wisconsin ranked 33rd among U.S. states in the ratio of the top 1% of income to the remaining 99% of income. The average income of the top .01% in Wisconsin was 399 times the average income of the bottom 99% of Wisconsin residents.
Share of Income Going to Top 1% has Climbed
The share of income taken home by the highest earners in Wisconsin has climbed over the last forty years, to the point where the top 1% took home 1 out of every 6 dollars of income in the state in 2014.
Figure 1 shows the U-shaped pattern measuring income inequality in Wisconsin and the nation over the last 100 years. In the late 1920s and into the 1930s, income inequality was stark, with the highest earners taking home a large share of the total income. After the crash in the late 1920s, and over the era of the New Deal— with its collective bargaining, retirement and unemployment security, financial regulation, progressive taxation— inequality fell as the income share claimed by top earners fell. In the 1970s, however, the trend in inequality reversed and it has been on the rise. Inequality is now back to the high levels posted just before the Great Depression.
Wisconsin, like many of the less urbanized and less populated states in the West and Midwest, has traditionally had less concentration of income at the very top. But while Wisconsin’s income distribution is slightly more equal than that of many other states, Wisconsin is keeping pace with the national trend of dramatic increases in inequality. After a period in the middle of the century when economic gains were widely shared, income inequality in Wisconsin and the nation has climbed steadily since the mid-1970s. The overall trend has been towards increased levels of income inequality, even if not every year fits into this pattern.
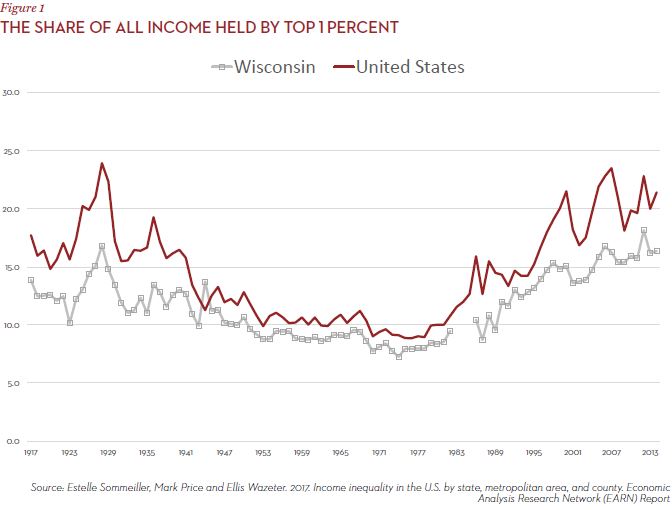
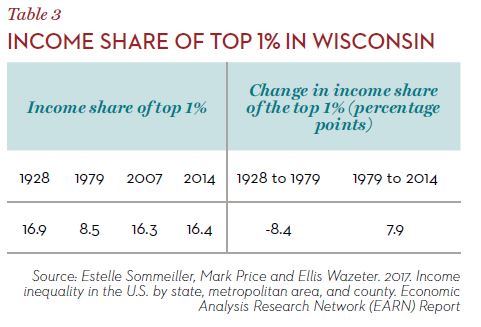
The share of income in Wisconsin going to the top 1% in 2014 was comparable to levels reached prior to the Great Depression. The top 1% in Wisconsin captured 16.4% of the income in 2014, or the equivalent of 1 out of every 6 dollars of income in the state. This share of income has more than doubled since 1974, when the top 1% in Wisconsin took home a low of 7.3% of all income in Wisconsin, or just 1 out of every 14 dollars of income.
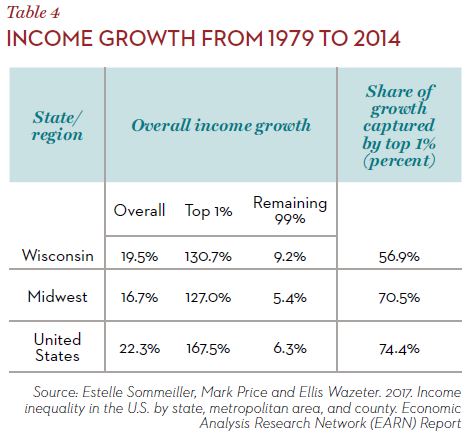
The trend toward growing concentration of income has been even more pronounced among higher income groups, within the top 1%. For example, the share of income captured by the top .01% in Wisconsin increased nearly eightfold between its low point in the 1970s and its current level, and the share of income captured by the top 0.1% increased more than fourfold over this same period. At the same time that the share of income going to the top 1% in Wisconsin has steadily climbed, income for everyone else in Wisconsin has remained stagnant. Between 1979 and 2014, average incomes for the top 1% in Wisconsin increased by 131%, after being adjusted for inflation. In contrast, the incomes of the remaining 99% grew by just nine percent over that period on average. Put another way, $57 out of every $100 of income growth that occurred between 1979 and 2014 in Wisconsin wound up in the pockets of the top 1%.
Expansion for Some: Highest Earners in Wisconsin Capture Large Share of Post-Recession Gains
Looking to the more recent past, it is clear that a large portion of the economic gains in the period of recovery from the 2007 recession have also been captured by the top 1%. During the recession –as in any other economic downturn– top earners in Wisconsin experienced a sizable loss of income. The share of income claimed by the top 1% dropped from 16.3% in 2007 to 15.4% in 2009, and the average income for this group dropped by more than $200,000 over that period.
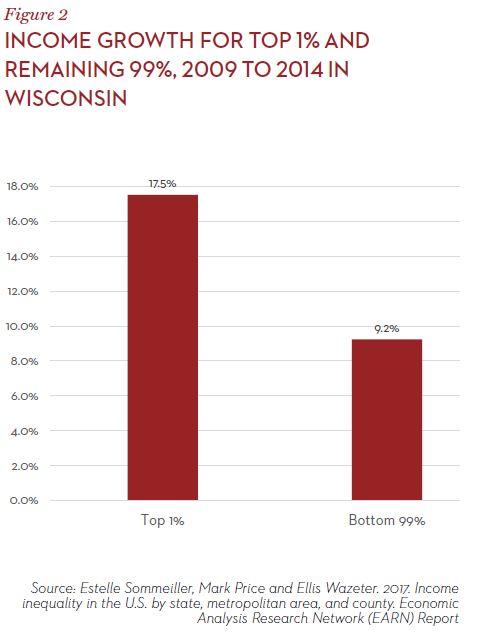
In the period of slow economic growth after the recession, the pattern of growth in income inequality in Wisconsin has resumed. Between 2009 and 2014, the top 1% captured 25.7% of all income gains in Wisconsin. The average income of the top 1% increased by 17.5% in Wisconsin between 2009 and 2014, while the remaining 99% experienced an average income growth of just 9.2%.
Income Inequality within Wisconsin
Within Wisconsin, there is considerable variation in income inequality among communities. Still, most Wisconsin metropolitan areas and counties have less income inequality than the national average.
The metropolitan areas with the highest levels of income inequality, as measured by the share of total income going to the top 1%, were Eau Claire (21.5% in 2014), Milwaukee-Waukesha-West Allis (18.8%) and Whitewater-Elkhorn (17.9%). None of those three had a greater share of income claimed by the top 1% than the national average. The metropolitan areas with the lowest levels of income inequality in Wisconsin were Shawano (9.1%), Watertown-Fort Atkinson (9.2%), and Merrill (9.5%).
The counties with the highest levels of income inequality were Eau Claire County, in which 26.2% of all income went to the top 1% of earners in 2014, Ozaukee County (24.0%) and Milwaukee (19.0%). In both Eau Claire and Ozaukee Counties, a greater share of the income was claimed by the top 1% than the national average. The counties with the lowest levels of income inequality in Wisconsin were Forest County (8.4%), Menominee County (8.5%), and Buffalo County (9.1%).
The appendix includes tables with the average income of the top 1%, average income for the remaining 99%, and the share of that went to the top 1% for all counties and metropolitan areas in Wisconsin.
Inequality by Income, Inequality by Race
This report focuses on income inequality in the state. While inequality is on the rise in the state, Wisconsin is actually more equal than the national average. But that doesn’t mean Wisconsin is consistently more equal in all ways. In fact, in terms of inequality by race, Wisconsin is among the most unequal states in the nation. Both COWS and Kids Forward have documented these extreme disparities. See, for example:
- Wisconsin’s Extreme Racial Disparity
- Race for Results: Wisconsin’s Need to Reduce Racial Disparities
- A Roadmap to Equity: A Two Generation Approach to Reducing Racial Disparities In Dane County
Wisconsin Can Choose a Different Course
There is no magic bullet to rectify the growth in inequality in our state—any more than there was a single cause. Many of the underlying trends causing the changes in our economic landscape are national and are related to broader changes in education, technology, and trade. Nevertheless, there are a number of steps we can take at both the state and federal level to keep income inequality from growing, including:
Build the skills and education of Wisconsin’s workforce. We need to continue to invest in and improve skills for our current and future workforce. This means continued support of our technical colleges and continued innovation to secure strong connections from training to employment. The state of Wisconsin has made important steps forward to help build stronger connections between training and skills and the needs of employers. The progress is important and should be supported. Continuing investment and leadership on building a strong statewide system of career pathways and bridges from adult basic education into skills training and other occupational content is a concrete way to extend opportunity to the lower rungs of the economic ladder.
Raise the minimum wage. The real value of the minimum wage has eroded substantially in the last forty years and the federal government has not raised the national minimum wage since it was raised to $7.25 per hour in 2009. Currently, 29 states and the District of Columbia have minimum wages set higher than the federal floor. The highest state minimum wage is $11 per hour, which is the wage floor in Washington and Massachusetts. (The minimum wage in Washington DC is $12.50 per hour.) In 18 states, the minimum wage is indexed to inflation, meaning that it grows predictably and along with prices. Raising the minimum wage supports low-wage workers, strengthens labor standards, and is popular with liberals and conservatives. As it did early in the 2000s, Wisconsin could raise its wage floor and help strengthen rewards to work.
Support working families. State and federal policy choices can help lessen the burden of income inequality by ensuring that work pays for low-income families and by removing impediments to work. One important way to accomplish those objectives is to expand access to paid family leave and sick days. In addition, state policymakers should help make work pay by reversing the cuts made in 2011 to the Earned Income Tax Credit (EITC) for parents, as the Governor proposed. In addition, state lawmakers should restore funding that has been cut from the Wisconsin Shares child care subsidy program and allow reimbursement rates to catch up to marketplace rates, because many parents are now unable to find quality child care providers who participate in the subsidy program.
Remove unrealistic Wisconsin Shares requirements relating to work schedules. Practices like “just-in-time scheduling” are increasingly common in low-wage, service-sector jobs. It is very common for workers in these jobs to learn their schedules only a couple of days in advance (and sometimes the day before). The current requirement of the Wisconsin Shares program of asking parents to provide their anticipated schedules (up to four weeks ahead of time) simply does not make sense in the context of nonstandard jobs with unpredictable schedules and prevents parents in need of child care from benefiting from the subsidies provided by the state. Until the state moves (as others are beginning to) to create a framework for standards on scheduling practices, state programs should be designed to connect to workers in these volatile and unpredictable work settings.
Ensure that workers have access to affordable health care. Another way to help ensure that work pays for low-income families is to take advantage of the Medicaid option in the Affordable Care Act that would finance almost all of the cost of extending BadgerCare to adults between 100% and 138% of the federal poverty level. That would not only enable the state to cover about 80,000 more adults in BadgerCare, but would also significantly reduce state costs and help avoid cuts in Medicaid and other portions of the state budget.
Make state taxes more equal across income groups. Residents of Wisconsin who have low incomes pay a greater share of their income in state and local taxes than do the highest earners. We can slow the growth of income inequality by reforming regressive taxes and making sure that residents with high incomes pay at least as much taxes relative to their income as people with lower incomes do. One way of doing this is by strengthening measures like the Homestead Credit, which provides property tax relief to homeowners and renters with low incomes, rather than approving the changes in the state budget bill that weaken the credit. In addition, Congress should significantly increase the small Earned Income Tax Credit for adults who do not have dependent children. That would help make work pay for childless adults, and it’s a policy change that has been endorsed by Congressman Ryan.
Remove barriers that prevent workers from getting to jobs. For individuals with little education and limited job opportunities, being able to drive a car can be the determining factor in finding a job or being unemployed. As the Employment & Training Institute at UW Milwaukee has argued, this insight requires a complete restructuring of our approach to license suspensions and driver’s education. First, the working poor would benefit from a less punitive approach in case they fail to pay for minor traffic violations like driving with a burnt-out taillight. Second, they would benefit from better license recovery counseling services (for example, expanding the current efforts of the Center for Driver’s License Recovery & Employability that currently serves only Milwaukee residents). Third, they would benefit from a different debt collection policy, for instance, one that does not rely on using “failure to pay forfeitures” license suspensions to collect municipal tickets, court judgments and fees unrelated to dangerous driving, or one that allows penalized drivers to obtain an occupation permit so they can drive to work and earn money to pay their fees.
| Income Inequality in Wisconsin Counties, 2014 | ||||
| County | Avg income of the top 1% | Avg income of the bottom 99% | Top-to-bottom ratio | Share of all income that goes to top 1% |
| Wisconsin | $933,136 | $48,167 | 19.4 | 16.4 |
| Adams | $365,924 | $34,218 | 10.7 | 9.7 |
| Ashland | $340,423 | $32,251 | 10.6 | 9.6 |
| Barron | $727,111 | $39,170 | 18.6 | 15.8 |
| Bayfield | $770,462 | $38,092 | 20.2 | 17 |
| Brown | $1,139,202 | $50,983 | 22.3 | 18.4 |
| Buffalo | $380,984 | $38,498 | 9.9 | 9.1 |
| Burnett | $364,821 | $32,847 | 11.1 | 10.1 |
| Calumet | $779,074 | $57,373 | 13.6 | 12.1 |
| Chippewa | $602,735 | $44,306 | 13.6 | 12.1 |
| Clark | $778,196 | $36,772 | 21.2 | 17.6 |
| Columbia | $719,259 | $50,693 | 14.2 | 12.5 |
| Crawford | $629,832 | $35,021 | 18 | 15.4 |
| Dane | $1,110,519 | $60,727 | 18.3 | 15.6 |
| Dodge | $676,010 | $47,174 | 14.3 | 12.6 |
| Door | $826,425 | $44,555 | 18.5 | 15.8 |
| Douglas | $425,117 | $38,581 | 11 | 10 |
| Dunn | $502,180 | $40,835 | 12.3 | 11 |
| Eau Claire | $1,562,034 | $44,344 | 35.2 | 26.2 |
| Florence | $397,032 | $39,650 | 10 | 9.2 |
| Fond du Lac | $800,847 | $45,613 | 17.6 | 15.1 |
| Forest | $343,969 | $38,120 | 9 | 8.4 |
| Grant | $431,196 | $38,859 | 11.1 | 10.1 |
| Green | $724,614 | $48,523 | 14.9 | 13.1 |
| Green Lake | $703,256 | $40,268 | 17.5 | 15 |
| Iowa | $665,239 | $45,501 | 14.6 | 12.9 |
| Iron | $403,415 | $30,460 | 13.2 | 11.8 |
| Jackson | $793,323 | $37,416 | 21.2 | 17.6 |
| Jefferson | $480,637 | $47,761 | 10.1 | 9.2 |
| Juneau | $406,745 | $36,340 | 11.2 | 10.2 |
| Kenosha | $575,485 | $49,190 | 11.7 | 10.6 |
| Kewaunee | $461,514 | $45,913 | 10.1 | 9.2 |
| La Crosse | $876,787 | $46,446 | 18.9 | 16 |
| Lafayette | $485,954 | $40,903 | 11.9 | 10.7 |
| Langlade | $461,825 | $33,222 | 13.9 | 12.3 |
| Lincoln | $401,301 | $38,639 | 10.4 | 9.5 |
| Manitowoc | $774,392 | $42,490 | 18.2 | 15.5 |
| Marathon | $878,524 | $47,806 | 18.4 | 15.7 |
| Marinette | $536,273 | $34,878 | 15.4 | 13.4 |
| Marquette | $434,762 | $37,078 | 11.7 | 10.6 |
| Menominee | $303,468 | $32,927 | 9.2 | 8.5 |
| Milwaukee | $921,152 | $39,687 | 23.2 | 19 |
| Monroe | $446,544 | $40,165 | 11.1 | 10.1 |
| Oconto | $426,416 | $42,827 | 10 | 9.1 |
| Oneida | $705,299 | $44,205 | 16 | 13.9 |
| Outagamie | $864,577 | $54,117 | 16 | 13.9 |
| Ozaukee | $2,568,544 | $82,058 | 31.3 | 24 |
| Pepin | $898,170 | $41,744 | 21.5 | 17.9 |
| Pierce | $648,312 | $54,248 | 12 | 10.8 |
| Polk | $446,857 | $41,968 | 10.6 | 9.7 |
| Portage | $725,393 | $45,111 | 16.1 | 14 |
| Price | $400,800 | $33,026 | 12.1 | 10.9 |
| Racine | $788,853 | $48,744 | 16.2 | 14.1 |
| Richland | $341,731 | $32,467 | 10.5 | 9.6 |
| Rock | $655,332 | $42,979 | 15.2 | 13.3 |
| Rusk | $374,241 | $30,108 | 12.4 | 11.2 |
| St. Croix | $1,130,129 | $65,946 | 17.1 | 14.8 |
| Sauk | $604,741 | $45,323 | 13.3 | 11.9 |
| Sawyer | $547,539 | $34,958 | 15.7 | 13.7 |
| Shawano | $416,515 | $37,144 | 11.2 | 10.2 |
| Sheboygan | $827,604 | $47,220 | 17.5 | 15 |
| Taylor | $455,353 | $33,548 | 13.6 | 12.1 |
| Trempealeau | $493,130 | $44,603 | 11.1 | 10 |
| Vernon | $402,102 | $37,043 | 10.9 | 9.9 |
| Vilas | $634,468 | $35,000 | 18.1 | 15.5 |
| Walworth | $1,014,445 | $46,937 | 21.6 | 17.9 |
| Washburn | $445,228 | $35,650 | 12.5 | 11.2 |
| Washington | $787,468 | $60,993 | 12.9 | 11.5 |
| Waukesha | $1,517,715 | $75,070 | 20.2 | 17 |
| Waupaca | $564,138 | $42,658 | 13.2 | 11.8 |
| Waushara | $500,585 | $35,725 | 14 | 12.4 |
| Winnebago | $806,448 | $45,816 | 17.6 | 15.1 |
| Income Inequality in Wisconsin Metro Areas, 2014 | ||||
| Metro Area | Avg income of the top 1% | Avg income of the bottom 99% | Top-to-bottom ratio | Share of all income that goes to top 1% |
| Wisconsin | $933,136 | $48,167 | 19.4 | 16.4 |
| Appleton | $846,757 | $54,798 | 15.5 | 13.5 |
| Baraboo | $604,741 | $45,323 | 13.3 | 11.9 |
| Beaver Dam | $676,010 | $47,174 | 14.3 | 12.6 |
| Eau Claire | $1,203,580 | $44,261 | 27.2 | 21.5 |
| Fond du Lac | $800,847 | $45,613 | 17.6 | 15.1 |
| Green Bay | $1,016,047 | $49,518 | 20.5 | 17.2 |
| Janesville-Beloit | $655,332 | $42,979 | 15.2 | 13.3 |
| La Crosse-Onalaska | $833,899 | $45,943 | 18.2 | 15.5 |
| Madison | $1,046,099 | $58,470 | 17.9 | 15.3 |
| Manitowoc | $774,392 | $42,490 | 18.2 | 15.5 |
| Marinette | $496,847 | $32,520 | 15.3 | 13.4 |
| Menomonie | $502,180 | $40,835 | 12.3 | 11.0 |
| Merrill | $401,301 | $38,639 | 10.4 | 9.5 |
| Milwaukee-Waukesha-West Allis | $1,193,946 | $52,113 | 22.9 | 18.8 |
| Oshkosh-Neenah | $806,448 | $45,816 | 17.6 | 15.1 |
| Platteville | $431,196 | $38,859 | 11.1 | 10.1 |
| Racine | $788,853 | $48,744 | 16.2 | 14.1 |
| Shawano | $367,462 | $37,276 | 9.9 | 9.1 |
| Sheboygan | $827,604 | $47,220 | 17.5 | 15.0 |
| Stevens Point | $725,393 | $45,111 | 16.1 | 14.0 |
| Watertown-Fort Atkinson | $480,637 | $47,761 | 10.1 | 9.2 |
| Wausau | $878,524 | $47,806 | 18.4 | 15.7 |
| Whitewater-Elkhorn | $1,014,445 | $46,937 | 21.6 | 17.9 |
| Wisconsin Rapids-Marshfield | $605,375 | $40,570 | 14.9 | 13.1 |